


The Morality of Abortion
Two debates, dozens of voices, hundreds of arguments, but just one topic. Emotive, morally complex and challenging, the issue is abortion. The tools here let you dig in to the debate, uncovering the important issues, combining the voices of specialists with the voices of the public, and voices from the past.
Welcome to Argument Analytics - tools that dig in to the debate, uncover positions and trends, and explore the dynamics. On the BBC Radio 4 website, you can see how they can also be used to support tips for How to Win an Argument. On the BBC Taster site you can try your hand at putting those tips into practice. You can also take on the role of Michael Buerk and run your own version of the Moral Maze with Debater.
Here you can use the Argument Analytics to dig into the episode of the Moral Maze broadcast on 11 Oct 2017 on its own or in conjunction with a historical context provided by an episode from five years ago. Further information about the techniques used can be found in a BBC News article.
Analytics are available at several points in the 11 Oct 2017 episode of The Moral Maze. These were livetweeted during the transmission. Use  the
the  and buttons to step through the time points to see how the debate unfolds.
Context
These buttons allow you to see how the debate has changed over time by including the Historical Context: an episode of The Moral Maze broadcast on 29 Feb 2012.
The Participants
Argument Map
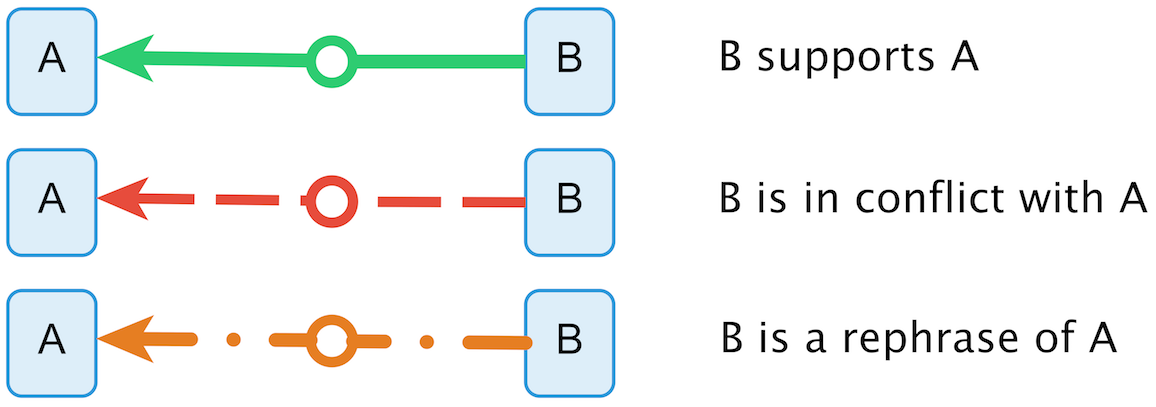
This is the raw material for all the other 'argument analytics'. What were the individual claims and reasons; how do they support and attack one another? Human analysts around the world contributed to the process of figuring out this structure, and we can lay out the entire debate (both within and between programmes) as a detailed map.
Debate Cogency
We can automatically count up the proportion of claims that have supporting evidence. The more the better. We call this property cogency.


Central Issues
The most central issues are those that are connected to the largest number of other highly central issues. The algorithm we use to calculate this is very similar to Google's PageRank technique. Once we have the most central issues, we can strip out words like 'think' and 'because' and what remains are the words (and pairs of words) that best characterise the central themes of the debate.
Turns Timeline


Who said what when? Who contributed the most to the discussion? The timeline makes it all clear because each contribution in our data is timestamped.
Conflict Hotspot Timeline


Where were the flashpoints in the debate. Human analysts identify all the relationships between what has been said: every time someone agrees, disagrees, argues, challenges and so on. When combined with the timestamps, we can automatically identify which 1-minute time windows have involve the greatest conflict.

Interactions
Who was interacting with whom? Because we track the structure of replies, we can see who responded to whom. This chord graph shows the proportion of each participant's interactions with all the others.


Like-mindedness

Like-mindedness. Who has the most similar views? We start with participant's stance on the overall issue – same stance, higher score. Then we refine this by averaging in the number of agreements between two participants over the total number of their interactions. More agreements, higher likemindedness.
Divisive Issues


Some issues are particularly important because they attract arguments both pro and con. The arguments that have the most arguments on both sides we call, divisive. We can calculate a divisiveness score for each issue automatically: the highest scoring are shown here, along with arguments on either side.
For an insight into the analysis and annotation process that allows these analytics to be produced, see our behind the scenes website.